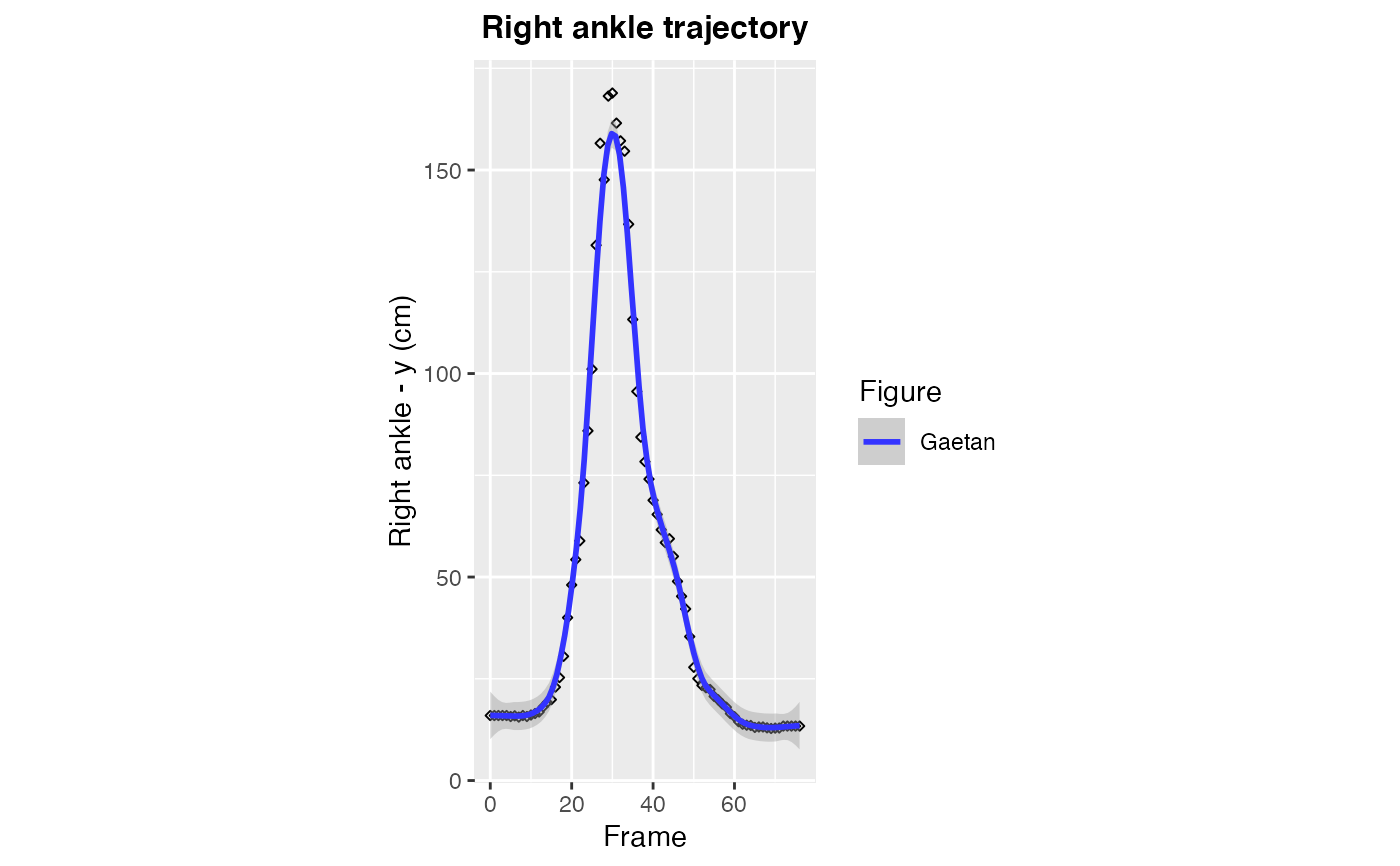
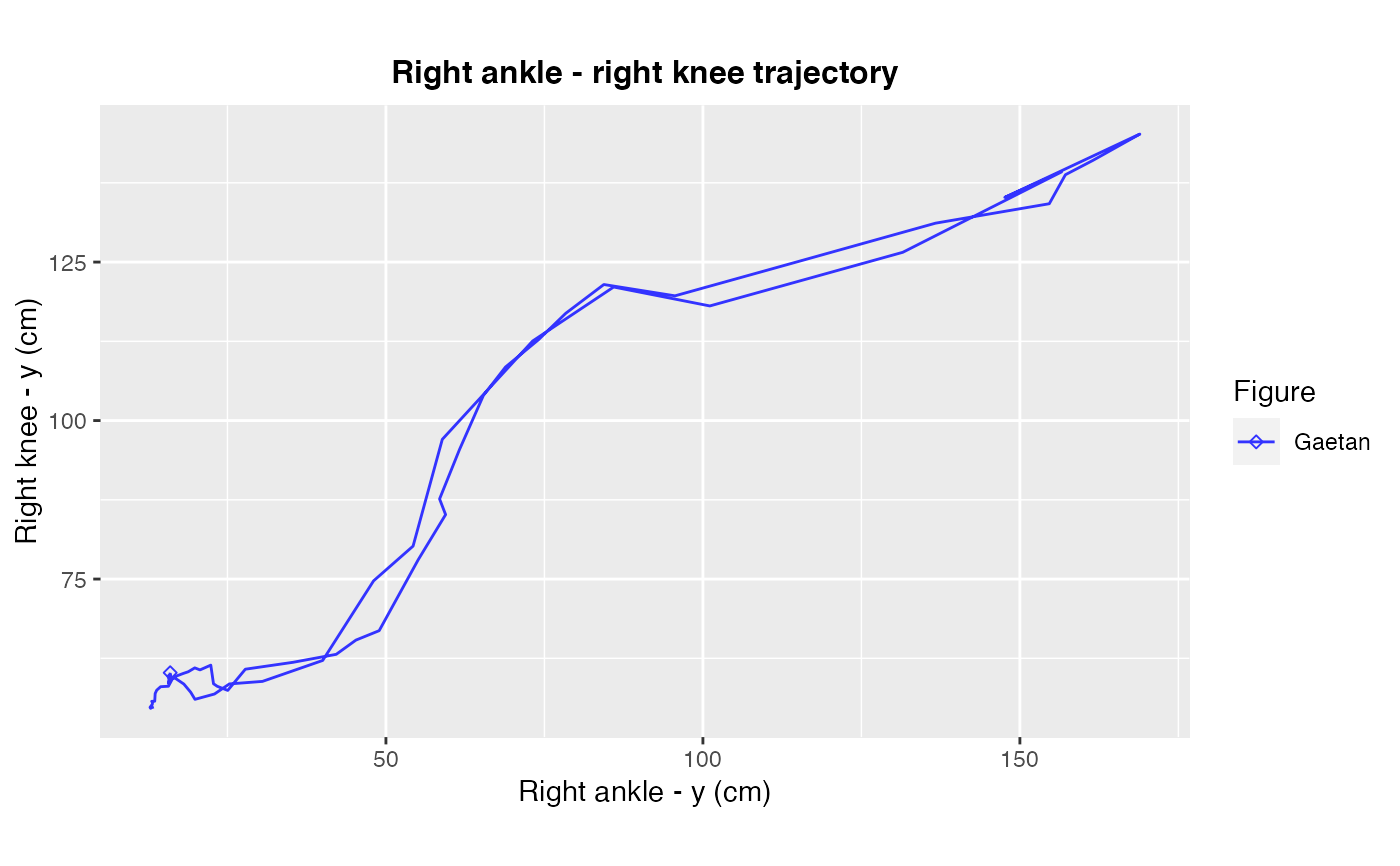
Graphical representation of the joints
flash.RdUse this function if you want to represent a particular joint as a function of time or one joint as a function of another joint.
flash(
  sidekick,
  plot.title,
  x.legend,
  y.legend,
  fig.color,
  size = 1,
  shape = 23,
  span = 0.15,
  ratio = 1
)
Arguments
| sidekick | A dataset formatted to be plotted with the superskeleton function, the sidekick information |
|---|---|
| plot.title | The title of your graphical output |
| x.legend | The legend on the x-axis |
| y.legend | The legend on the y-axis |
| fig.color | A vector of colours, one colour per figure |
| size | The size of the points in the geom_point function |
| shape | The shape of the points in the geom_point function |
| span | The amount of smoothing in the geom_smooth function |
| ratio | The ration x-axis and y-axis |
Value
The static representation of the sidekick data
Examples
data(gaetan_apchagi)
data(human)

S1_right_ankle <- sidekick(joint=gaetan_apchagi, num.joint=2, num.name=8,
num.x=6, num.y=4, joint1="RIGHT_ANKLE", joint2=NULL)
flash(sidekick = S1_right_ankle, plot.title="Right ankle trajectory",
x.legend="Frame", y.legend="Right ankle - y (cm)", fig.color="#3333FF")


S2_right_ankle_knee <- sidekick(joint=gaetan_apchagi, num.joint=2, num.name=8,
num.x=4, num.y=4, joint1="RIGHT_ANKLE", joint2="RIGHT_KNEE")
flash(sidekick=S2_right_ankle_knee, plot.title="Right ankle - right knee trajectory",
x.legend="Right ankle - y (cm)", y.legend="Right knee - y (cm)", fig.color="#3333FF")
