Graphical representation of the joints
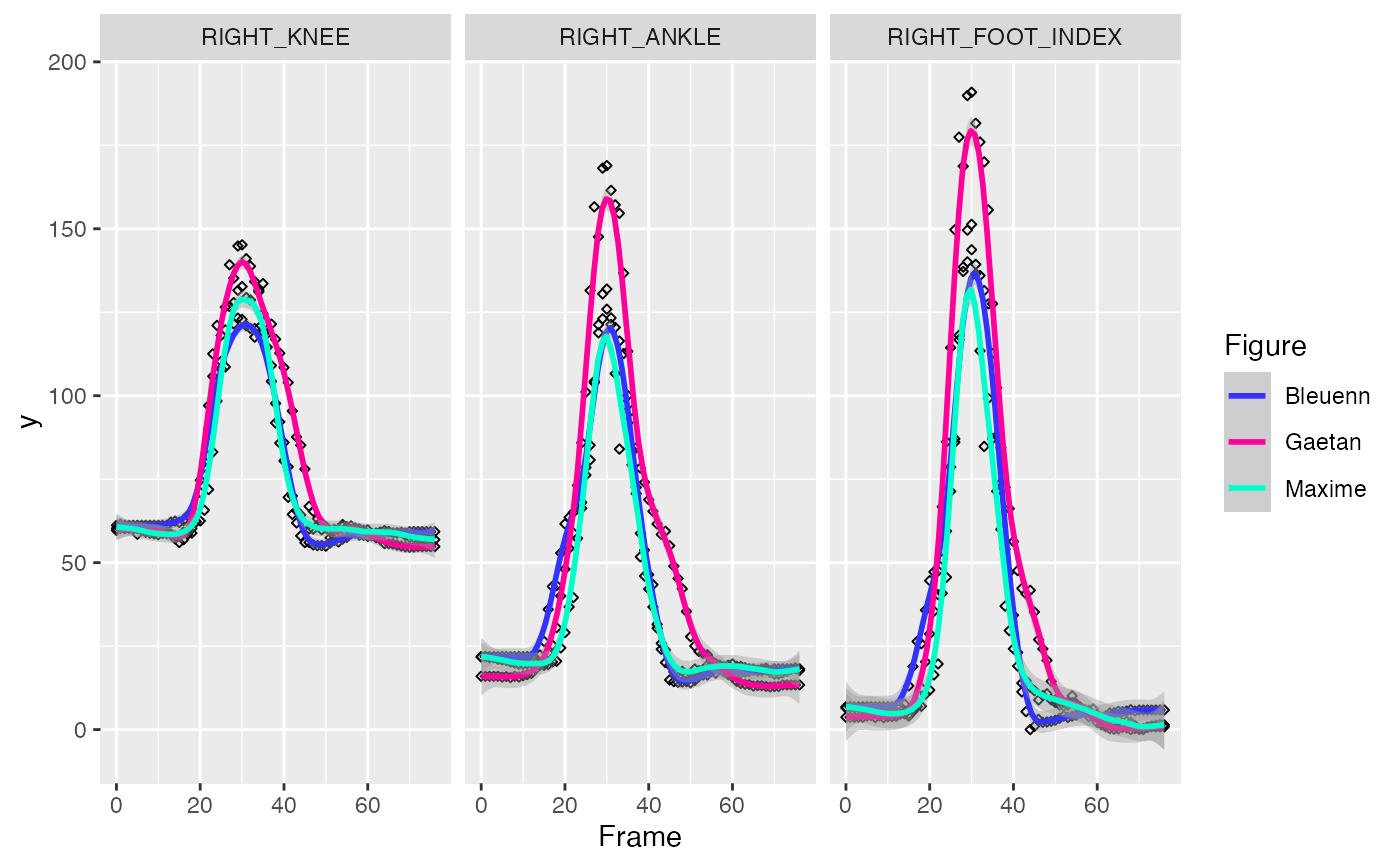
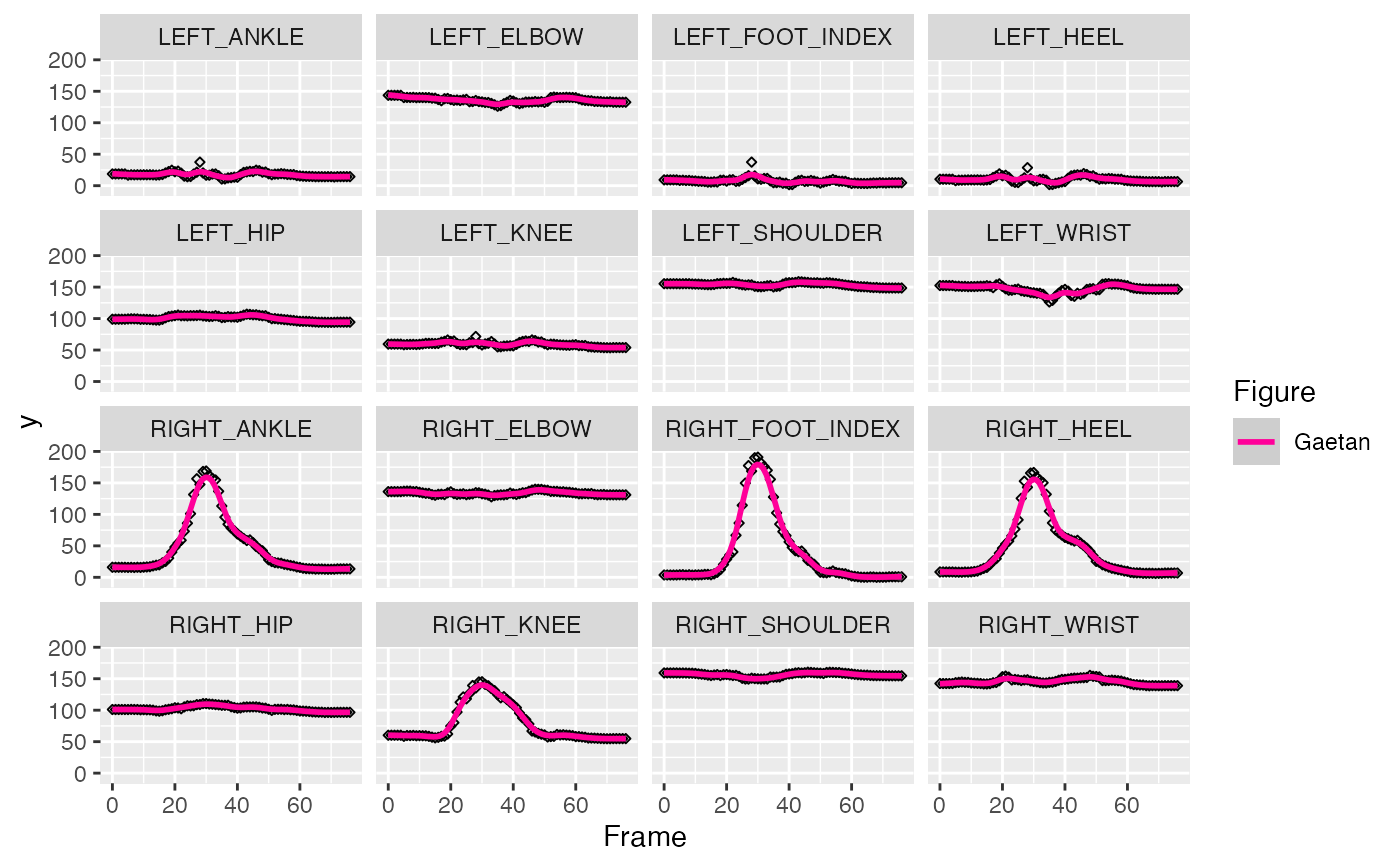
joint.RdThis function allows you to represent the joints as a function of time. The main argument is the dimension you want to represent on the y-axis. You can use this function to compare several practitioners at the same time, in that case, make sure to specify a proper vector of colours.
joint(
  joint,
  num.joint,
  num.frame,
  num.y,
  num.name,
  y.legend,
  fig.color,
  vect.joint = NULL,
  size = 1,
  shape = 23,
  span = 0.15
)
Arguments
| joint | The joint dataset: the coordinates of the joints as a function of time |
|---|---|
| num.joint | The index of the column associated with the joint variable |
| num.frame | The index of the column associated with the frame variable |
| num.y | The index of the column associated with the y-axis variable represented on the graphical output |
| num.name | The index of the column associated with the name variable |
| y.legend | The legend on the y-axis |
| fig.color | A vector of colours, one colour per figure |
| vect.joint | A vector of joints |
| size | The size of the points in the geom_point function |
| shape | The shape of the points in the geom_point function |
| span | The amount of smoothing in the geom_smooth function |
Value
A representation of the joints
Examples
data(all_apchagi)
joint(joint=all_apchagi, num.joint=2, num.frame=6, num.y=4, num.name=8, y.legend="y",
fig.color=c("#3333FF", "#FF0099", "#00FFCC"),
vect.joint = c("RIGHT_KNEE", "RIGHT_ANKLE", "RIGHT_FOOT_INDEX"))


data(gaetan_apchagi)
joint(joint=gaetan_apchagi, num.joint=2, num.frame=6, num.y=4, num.name=8, y.legend="y",
fig.color="#FF0099")
