Description of a categorical or continuous variable with qualitative and quantitative data
The first method of the Automatic Univariate Description submenu is the description of either continuous or categorical variable by both continuous and categorical variables. 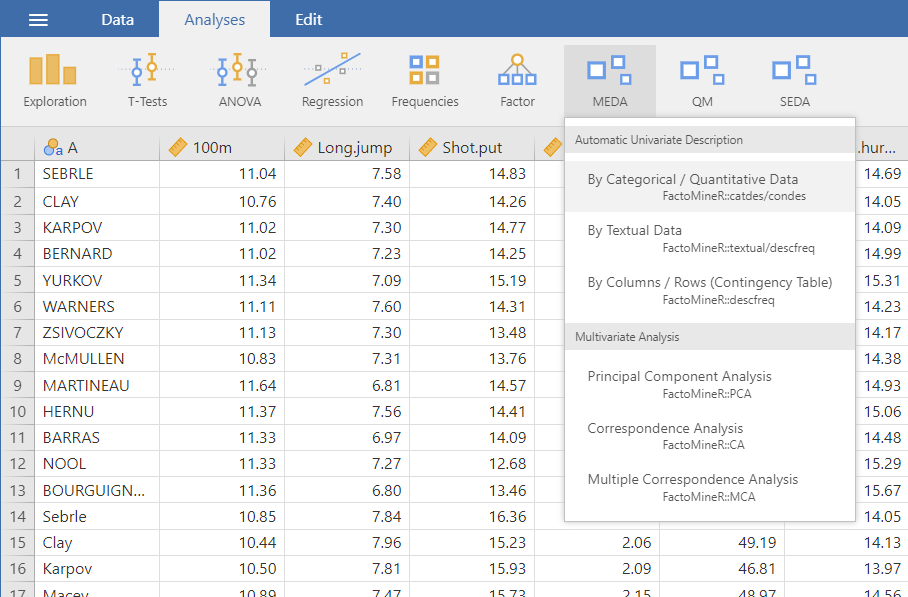
The interface
As it can be seen in the figure above, the interface is very simple and only has 3 fields you need to worry about.
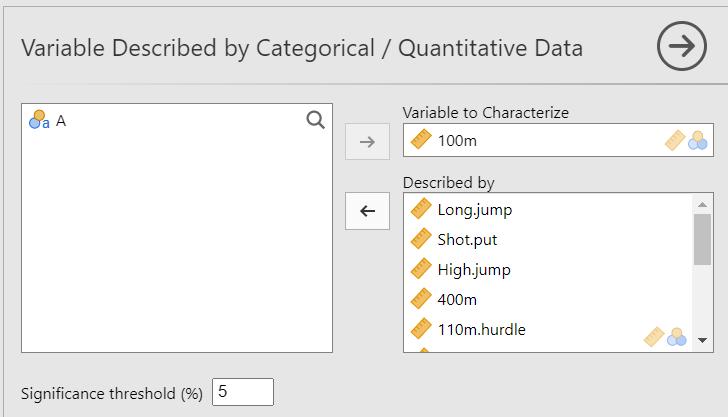 Firstly, the Variable to Characterize take either a continuous or categorical variable that you wish to describe. Then, you put the continuous and categorical variables you want to use for the characterization of the variable. Lastly, the Significance threshold option set the threshold under which a variable is significantly describing the variable to characterize.
Examples
There are two ways of using this methods. You can either use it to see what variables are significantly describing the variable to characterize or you can set the Significance threshold to 100 so that you have the indicators (R², correlation, etc.) for all the variables.
For the following examples, we will be using the bugs data set (available with Jamovi): 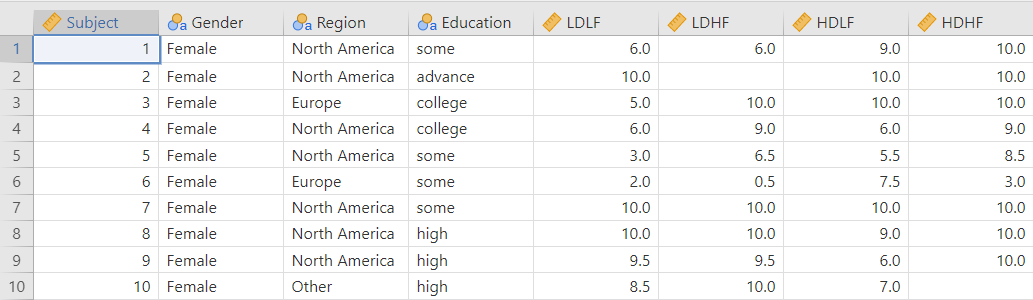
Description of a continuous variable
For this example we are going to describe the LDLF variable using all the other variables (except Subject) and let the default value for the Significance threshold: 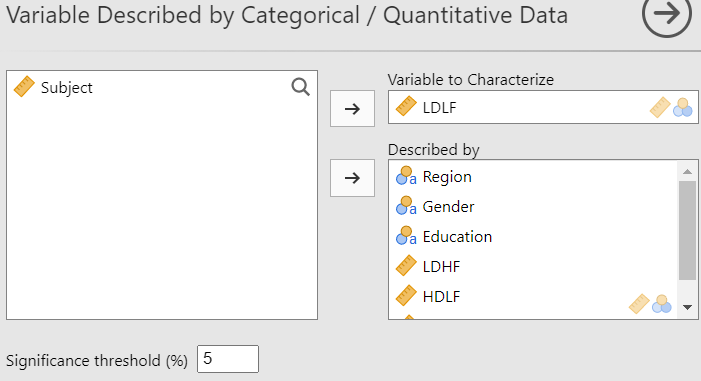
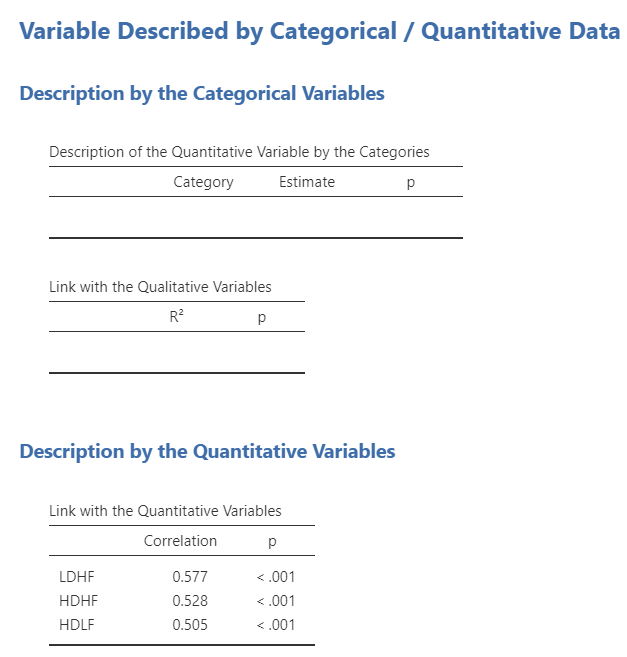
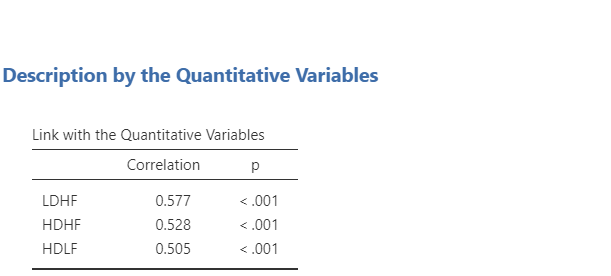
We can see that for a threshold of 0.05, none of the categorical variables significantly describes the LDFL variable. However, the 3 continuous variables are significantly correlated (for a threshold of 0.05) to LDLF with correlations between 0.5 and 0.6.
Now, let’s set the Significance threshold to 100 to get a complete description of the variable. 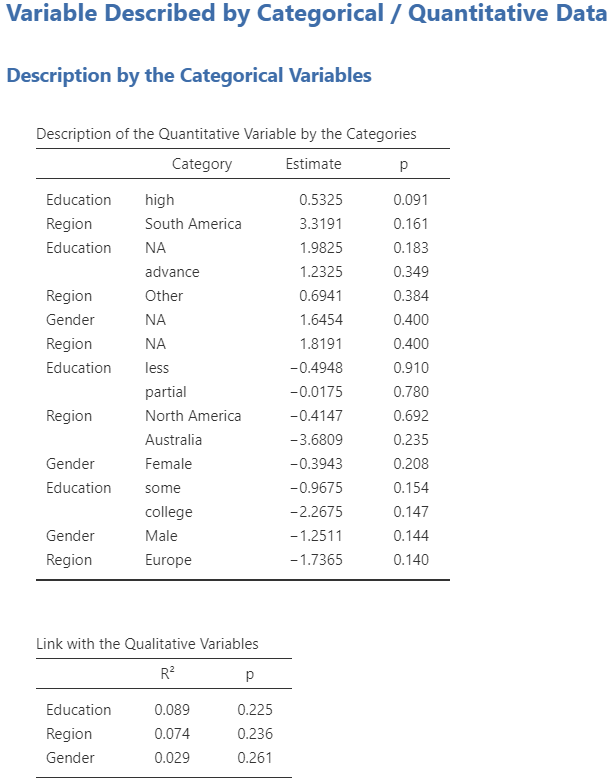
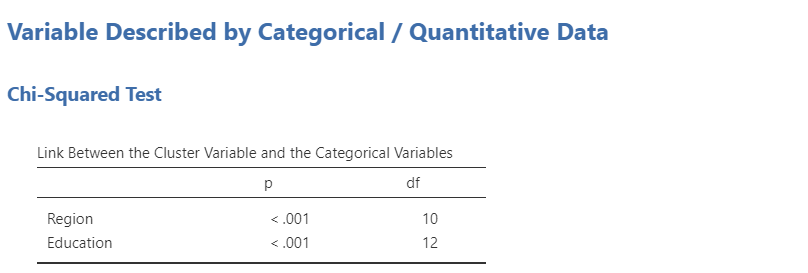
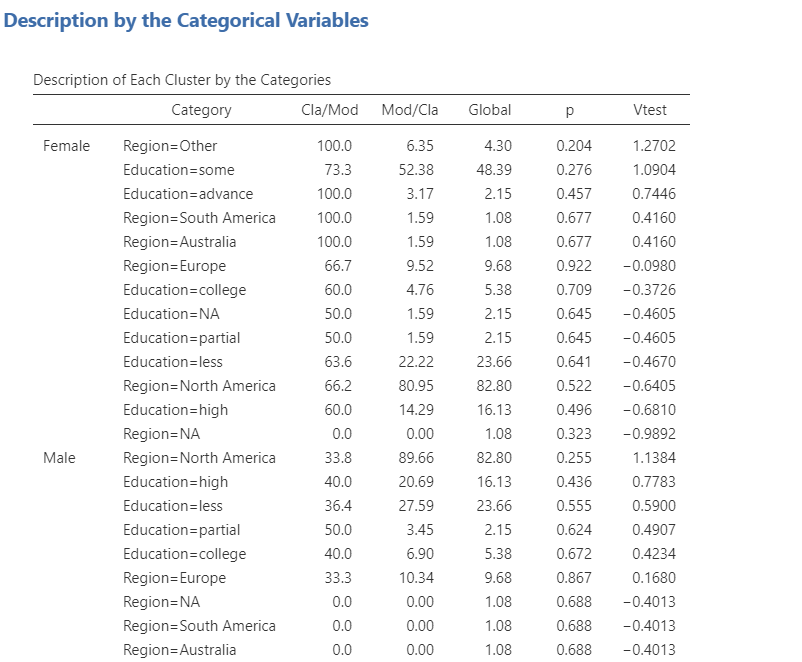
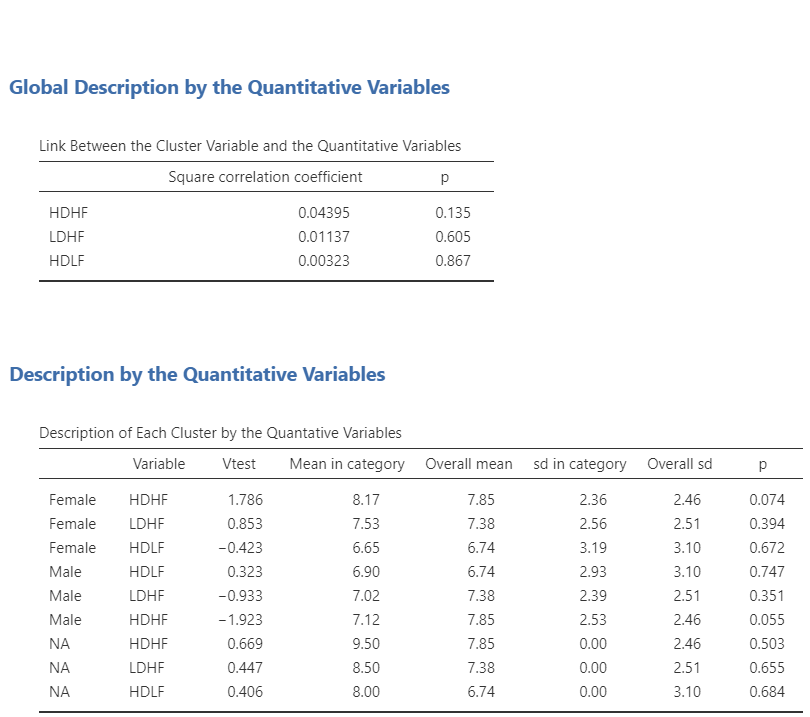
Description of a categorical variable
Let’s describe the gender variable and set the threshold to 100 to see all the output.