Description of a contingency table
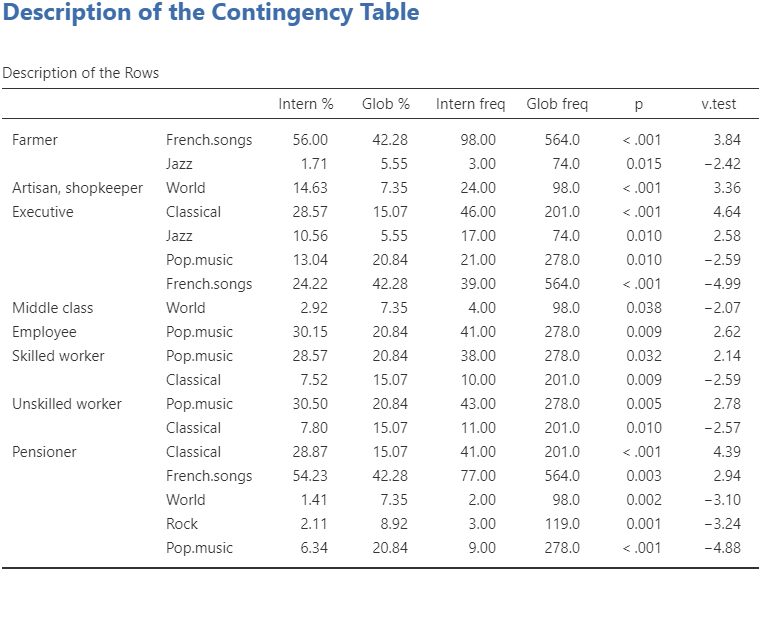
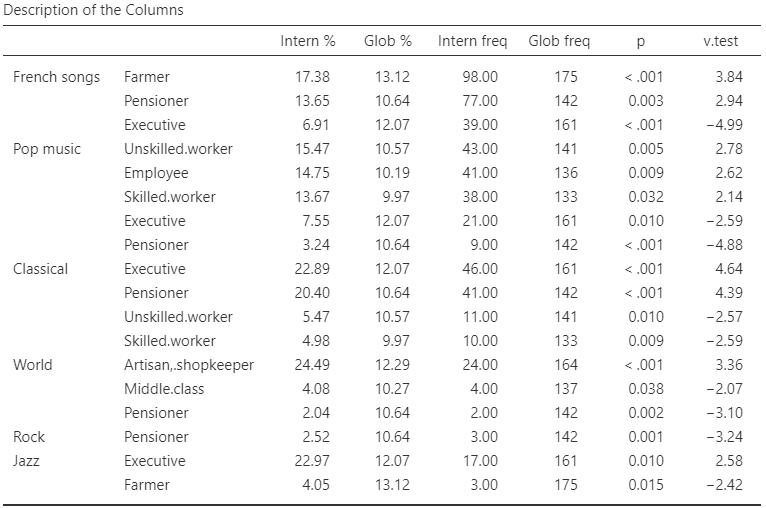
The last method of the Automatic Univariate Description submenu is the description of a contingency table. More precisely, this analysis is used to describe the rows using the columns (and vice versa). 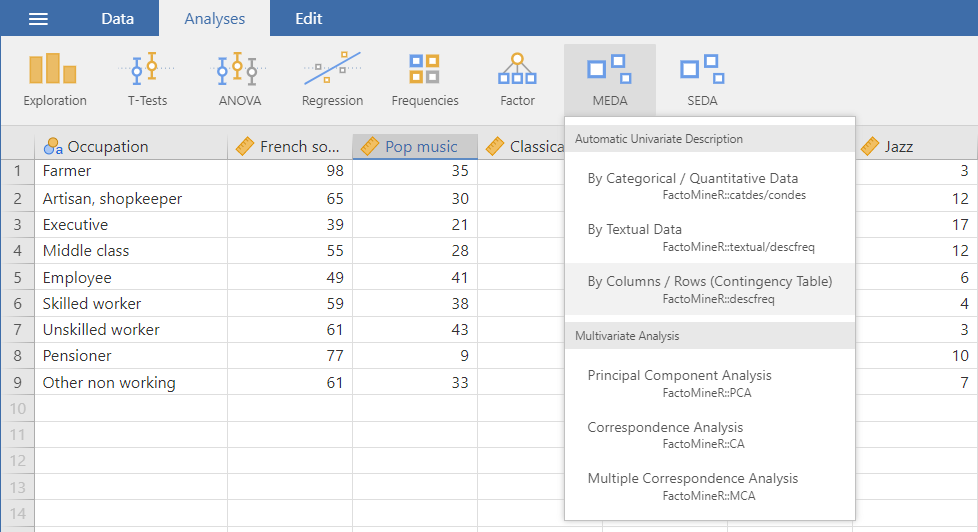
The interface
Similarly to the other 2 methods of this submenu, the interface only has 3 parts to interact with. You have to indicate the column containing the rows labels, the columns holding the frequencies and the significance threshold. 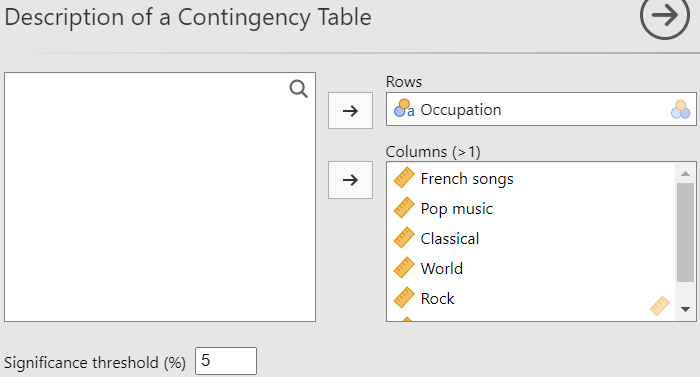
Potential issue(s)
For the analysis to run smoothly, make sure that all the columns with the frequencies have a continuous ( ) measure type and not a nominal (
 ) measure type. If this condition is not met, an error will occur. This is due to the fact that nominal variables in Jamovi are imported as factor in R.
Example
For this example, we will be using the music data set (available with MEDA) which you can see in the first figure using the settings viewable on the second figure.